American Football NFL 2025/2026 USA NFL Diashow
NFL: Diese Teams haben 2025 den schwersten Spielplan
 NFLAmerican Football(M)

«
NFL: Diese Teams haben 2025 den schwersten Spielplan
33 Bilder
NFL: Diese Teams haben 2025 den schwersten Spielplan
Mitte Mai kommt der Spielplan für die kommende NFL-Saison raus. Die Gegner für alle Teams stehen bereits fest. Im Strength of Schedule (SoS) ist abzulesen, wen es besonders hart trifft. Er rechnet die Bilanzen der Gegner aus dem Vorjahr zusammen. In diesem Jahr erwischt es die Teams aus dem Norden und Osten der NFC besonders hart. Das wirkt sich auch auf die vorausgesagten Siege bei den Buchmachern in Vegas aus.
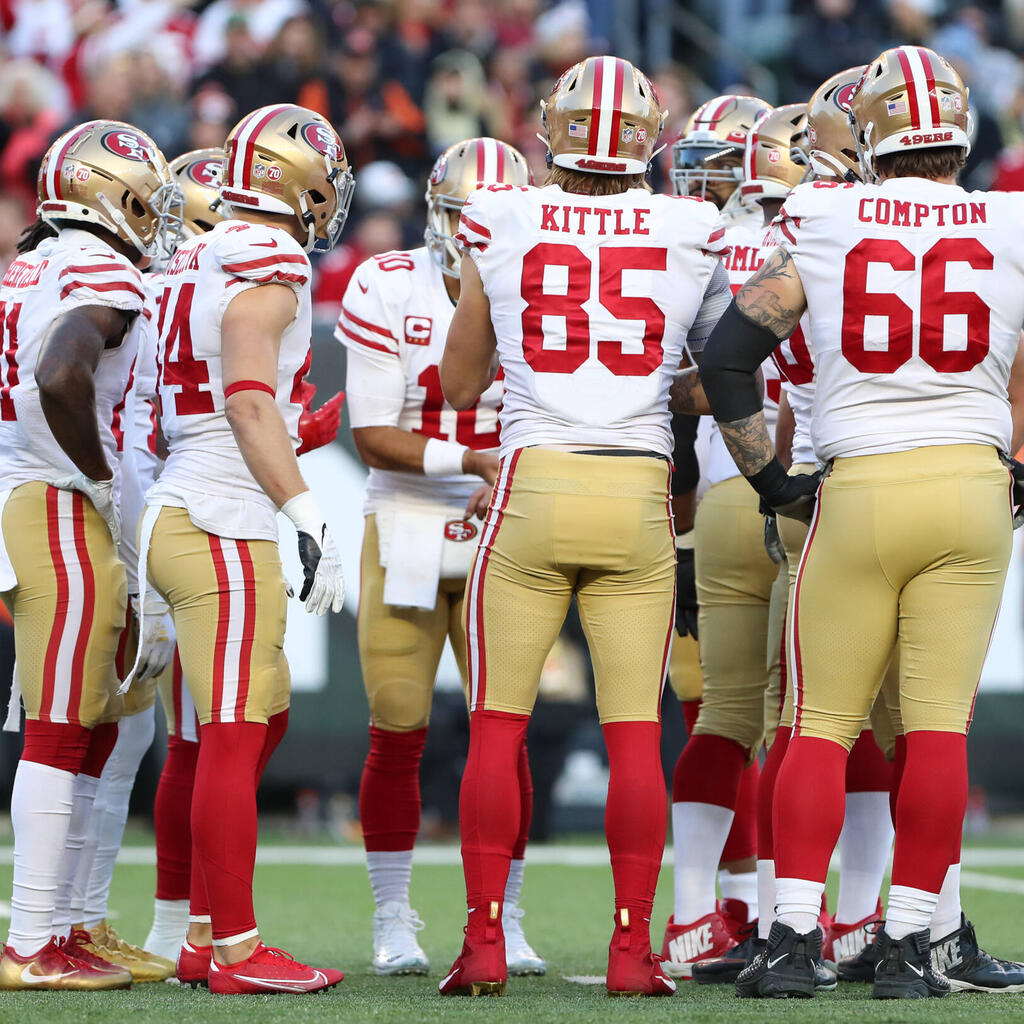
Platz 32: San Francisco 49ers
Strength of Schedule (SoS): 120 Siege zu 169 Niederlagen | Gewinnbilanz der Gegner in Prozent: 41,5 % | Projected Wins in Vegas: 10,5
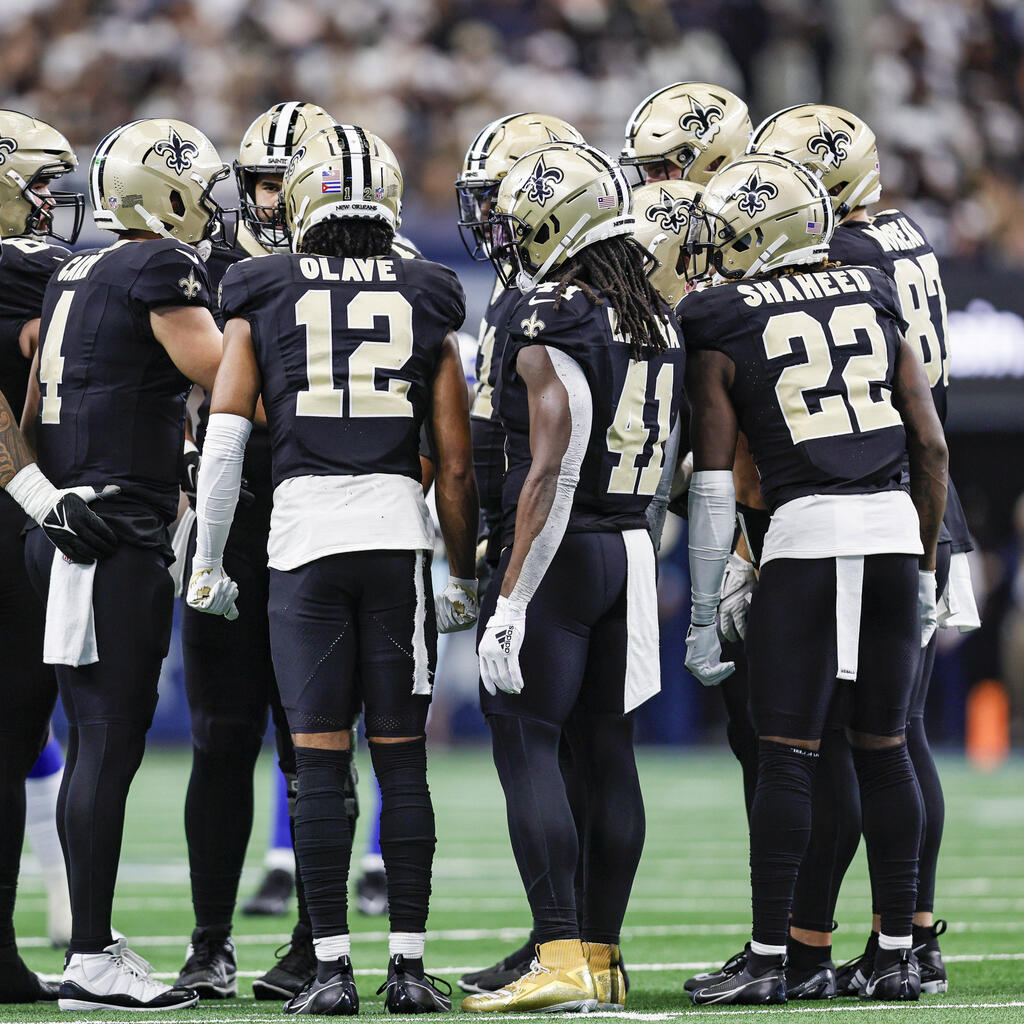
Platz 31: New Orleans Saints
SoS: 121-168 | Gewinnbilanz der Gegner in Prozent: 41,9 % | Projected Wins: 6,5
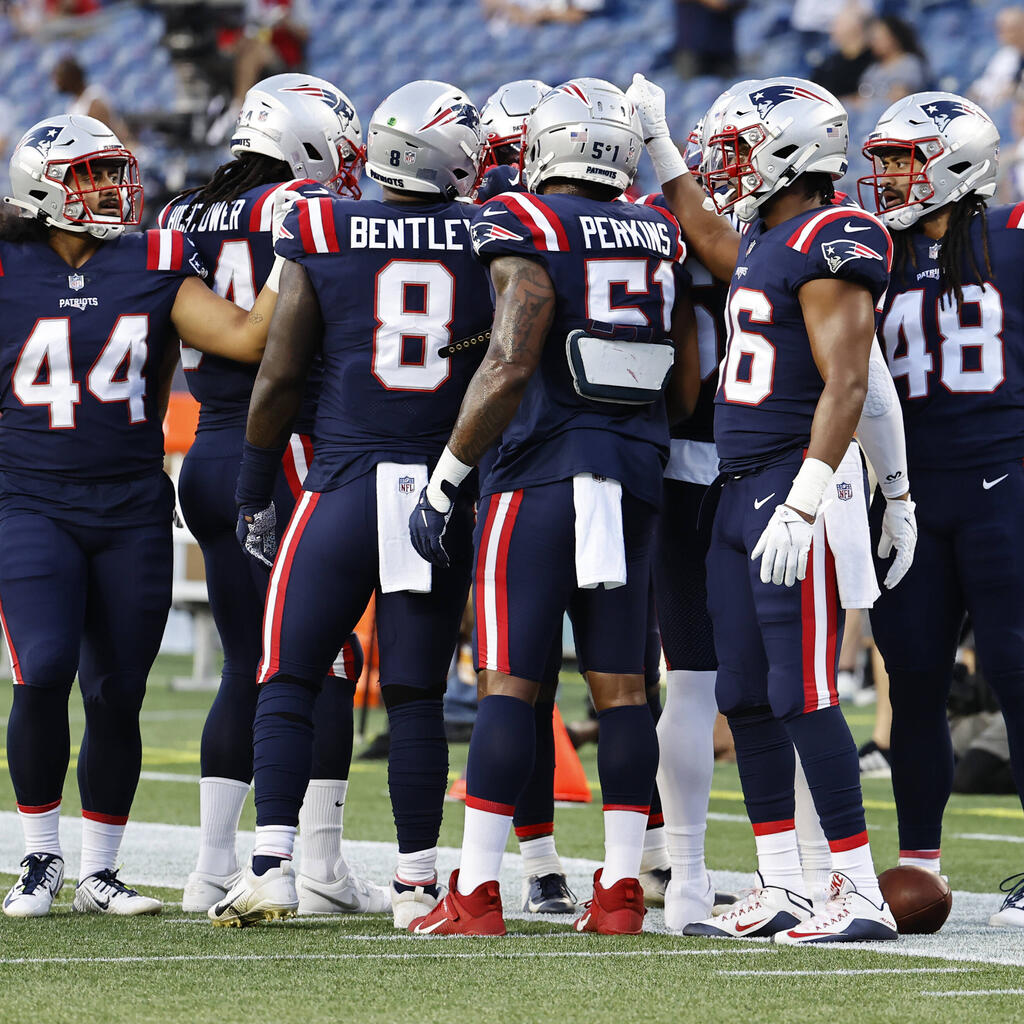
Platz 30: New England Patriots
SoS: 124-165 | Gewinnbilanz der Gegner in Prozent: 42,9 % | Projected Wins: 7,5
Platz 29: Tennessee Titans
SoS: 130-159 | Gewinnbilanz der Gegner in Prozent: 45,0 % | Projected Wins: 5,5
Platz 27: Carolina Panthers
SoS: 132-157 | Gewinnbilanz der Gegner in Prozent: 45,7 % | Projected Wins: 6,5
Platz 27: Arizona Cardinals
SoS: 132-157 | Gewinnbilanz der Gegner in Prozent: 45,7 % | Projected Wins: 8,5
Platz 26: New York Jets
SoS: 133-156 | Gewinnbilanz der Gegner in Prozent: 46,0 % | Projected Wins: 5,5
Platz 25: Indianapolis Colts
SoS: 134-155 | Gewinnbilanz der Gegner in Prozent: 46,4 % | Projected Wins: 7,5
Platz 23: Jacksonville Jaguars
SoS: 135-154 | Gewinnbilanz der Gegner in Prozent: 46,7 % | Projected Wins: 7,5
Platz 23: Buffalo Bills
SoS: 135-154 | Gewinnbilanz der Gegner in Prozent: 46,7 % | Projected Wins: 11,5
Platz 21: Seattle Seahawks
SoS: 137-152 | Gewinnbilanz der Gegner in Prozent: 47,4 % | Projected Wins: 7,5
Platz 21: Miami Dolphins
SoS: 137-152 | Gewinnbilanz der Gegner in Prozent: 47,4 % | Projected Wins: 8,5
Platz 20: Atlanta Falcons
SoS: 138-151| Gewinnbilanz der Gegner in Prozent: 47,8 % | Projected Wins: 7,5
Platz 18: Tampa Bay Buccaneers
SoS: 139-150 | Gewinnbilanz der Gegner in Prozent: 48,1 % | Projected Wins: 9,5
Platz 18: Houston Texans
SoS: 139-150 | Gewinnbilanz der Gegner in Prozent: 48,1 % | Projected Wins: 9,5
Platz 17: Los Angeles Rams
SoS: 142-147 | Gewinnbilanz der Gegner in Prozent: 49,1 % | Projected Wins: 9,5
Platz 16: Las Vegas Raiders
SoS: 145-144 | Gewinnbilanz der Gegner in Prozent: 50,2 % | Projected Wins: 6,5
Platz 15: Denver Broncos
SoS: 146-143 | Gewinnbilanz der Gegner in Prozent: 50,5 % | Projected Wins: 9,5
Platz 14: Cincinnati Bengals
SoS: 147-142 | Gewinnbilanz der Gegner in Prozent: 50,9 % | Projected Wins: 9,5
Platz 13: Cleveland Browns
SoS: 150-139 | Gewinnbilanz der Gegner in Prozent: 51,9 % | Projected Wins: 5,5
Platz 11: Los Angeles Chargers
SoS: 151-138 | Gewinnbilanz der Gegner in Prozent: 52,2 % | Projected Wins: 9,5
Platz 11: Kansas City Chiefs
SoS: 151-138 | Gewinnbilanz der Gegner in Prozent: 52,2 % | Projected Wins: 11,5
Platz 10: Pittsburgh Steelers
SoS: 152-137 | Gewinnbilanz der Gegner in Prozent: 52,6 % | Projected Wins: 8,5
Platz 9: Baltimore Ravens
SoS: 154-135 | Gewinnbilanz der Gegner in Prozent: 53,3 % | Projected Wins: 11,5
Platz 8: Washington Commanders
SoS: 159-130 | Gewinnbilanz der Gegner in Prozent: 55,0 % | Projected Wins: 9,5
Platz 5: Minnesota Vikings
SoS: 161-128 | Gewinnbilanz der Gegner in Prozent: 55,7 % | Projected Wins: 8,5
Platz 5: Green Bay Packers
SoS: 161-128 | Gewinnbilanz der Gegner in Prozent: 55,7 % | Projected Wins: 9,5
Platz 5: Dallas Cowboys
SoS: 161-128 | Gewinnbilanz der Gegner in Prozent: 55,7 % | Projected Wins: 7,5
Platz 4: Philadelphia Eagles
SoS: 162-127 | Gewinnbilanz der Gegner in Prozent: 56,1 % | Projected Wins: 11,5
Platz 2: Detroit Lions
SoS: 165-124 | Gewinnbilanz der Gegner in Prozent: 57,1 % | Projected Wins: 10,5
Platz 2: Chicago Bears
SoS: 165-124 | Gewinnbilanz der Gegner in Prozent: 57,1 % | Projected Wins: 8,5
Platz 1: New York Giants
SoS: 166-123 | Gewinnbilanz der Gegner in Prozent: 57,4 % | Projected Wins: 5,5